Yorchi

Your data, well designed and put to work.

Yorchi designs databases, builds websites and mobile apps that run on them, and analyzes your data with statistics and machine learning, so your decisions rest on numbers you can trust.

  • Database design
  • Websites and mobile apps
  • Database apps
  • Data science
A database diagram linking customers, orders, and products, feeding a mobile app and a sales forecast chart Customer customer_idnamecity Order order_iddatetotal Product product_idpricecategory
One project, start to finish: the database, the app that uses it, and a forecast from the data it collects.

What we build

Hire us for one piece or the whole path, from your website and app to the data behind them and what it tells you.

Database design

We model your data so it stays accurate as your business grows: no duplicate records, no conflicting numbers, and queries that stay fast.

  • ER diagrams and data models
  • Normalization and clean-up
  • SQL, stored procedures, and triggers
  • Moving data out of spreadsheets
  • Security, users, and backups
  • Oracle and MySQL databases

Websites and mobile apps

We design your website and a matching mobile app, so customers can find you, learn about you, and reach you from any device.

  • Custom website design
  • Companion mobile apps
  • Designs that work on any screen size
  • Online forms, booking, and ordering
  • Secure hosting and SSL setup
  • Updates and maintenance

Database applications

We build the tools your team and customers use to work with your data, on the web and on their phones, all connected to the same reliable database.

  • Web apps with secure logins
  • Mobile apps for phones and tablets
  • Forms that replace paper and email
  • Dashboards and reports
  • Student and customer portals
  • Connections to the systems you have

Data science

We turn the data you already collect into clear answers, with the statistics to show how much you can rely on each one.

  • Regression and forecasting
  • Prediction and confidence intervals
  • Hypothesis tests and A/B tests
  • Machine learning models
  • Probability and risk analysis
  • Plain-language reports and charts

Questions your data can answer

A few of the questions a good database and the right analysis can settle.

How many units will we sell next quarter?
Forecasting with a range you can plan around.
Which customers are likely to stop buying?
Machine learning models that flag who to contact first.
Did the new process actually make a difference?
Hypothesis tests that separate real change from noise.
Why don't our reports agree with each other?
A single, well-designed database behind every report.
Can our staff enter data from their phones?
A mobile app connected straight to your database.
What drives our results the most?
Regression that shows which factors matter, and by how much.

Try a working demo

The best way to see how we build is to use something we built. Explore it with sample data, and change anything you like.

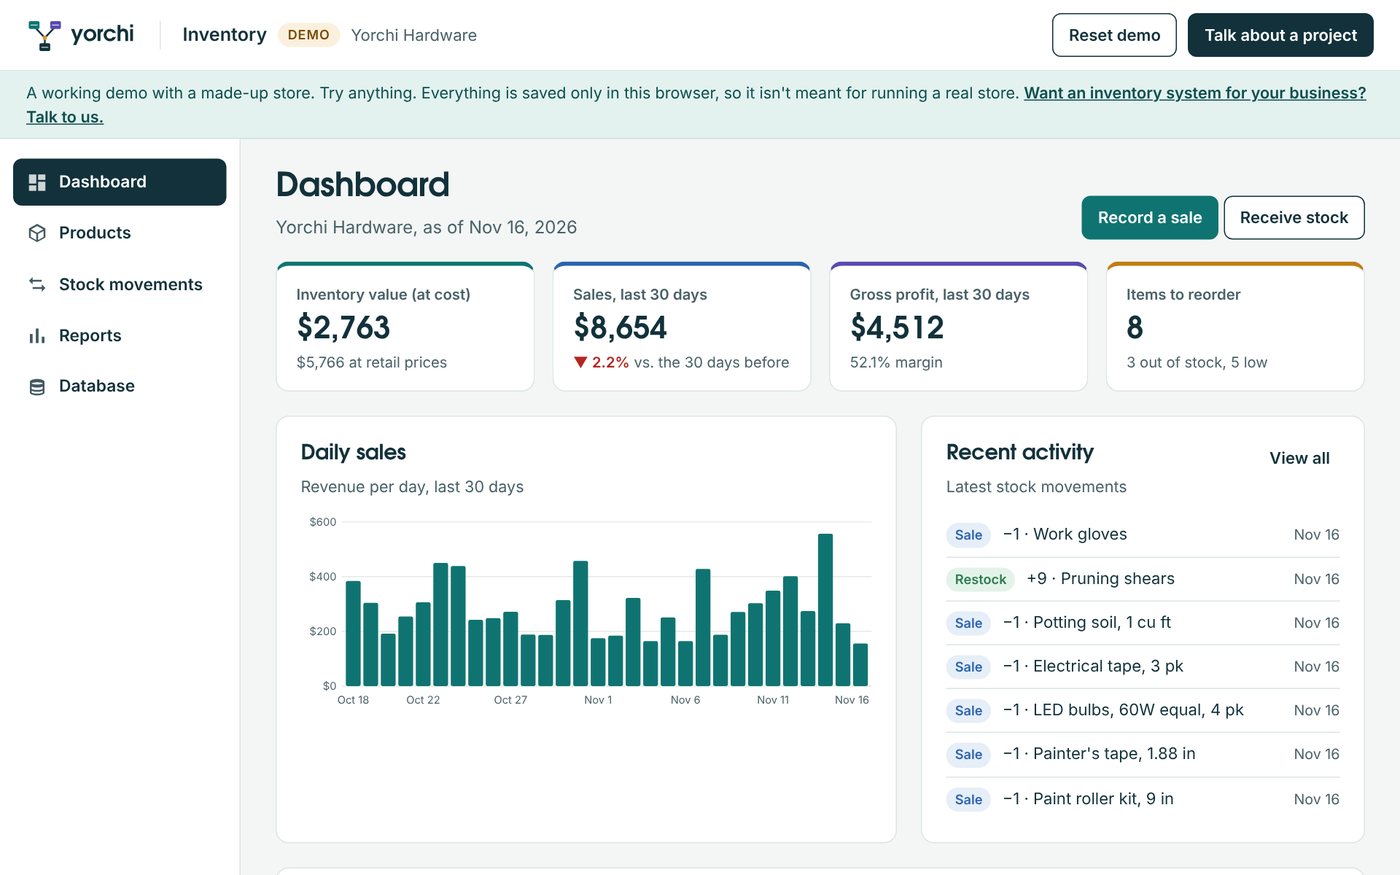
Inventory dashboard showing inventory value, 30-day sales, a daily sales chart, and products that need reordering
Database + web app

Inventory system

A neighborhood hardware store with 29 products, six suppliers, and 90 days of sales history.

  • Live stock levels with low-stock and out-of-stock alerts
  • Sales, deliveries, and adjustments, each recorded in the history
  • Reports: top sellers, inventory value, purchase orders by supplier
  • The database design and SQL behind every screen, with a MySQL script to download
Open the demo
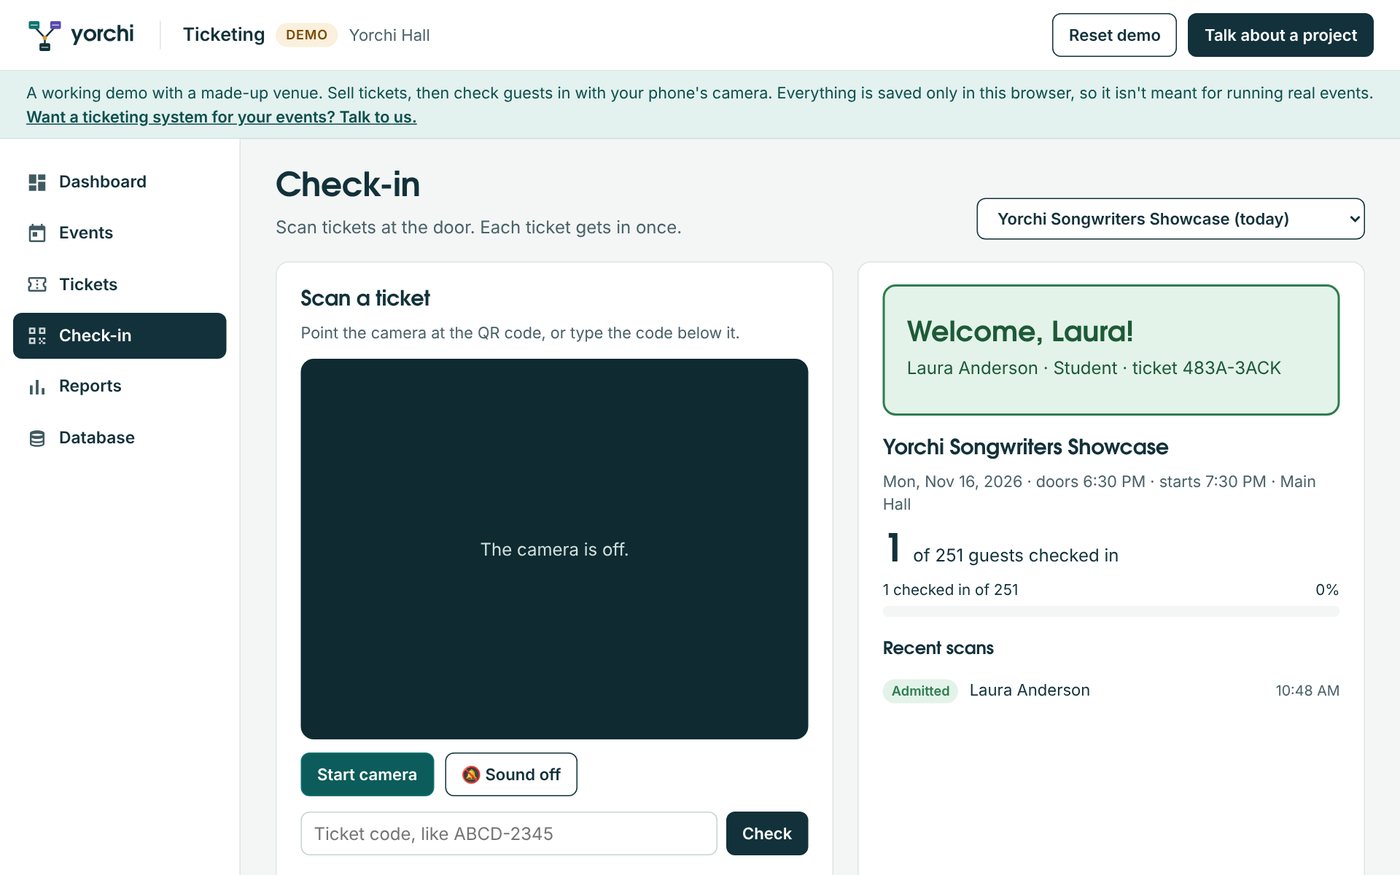
Ticket check-in screen with a camera scanner, a guest welcome message, and a count of guests checked in
Database + web app + QR codes

Event ticketing

A community venue with events before and after today, ticket types, and hundreds of orders.

  • Box office sales with limits on seats and ticket types
  • A QR code on every ticket, ready to print
  • Check-in at the door with a phone's camera: each ticket gets in once
  • Refunds, attendance and no-show reports, and the database behind it all
Open the demo
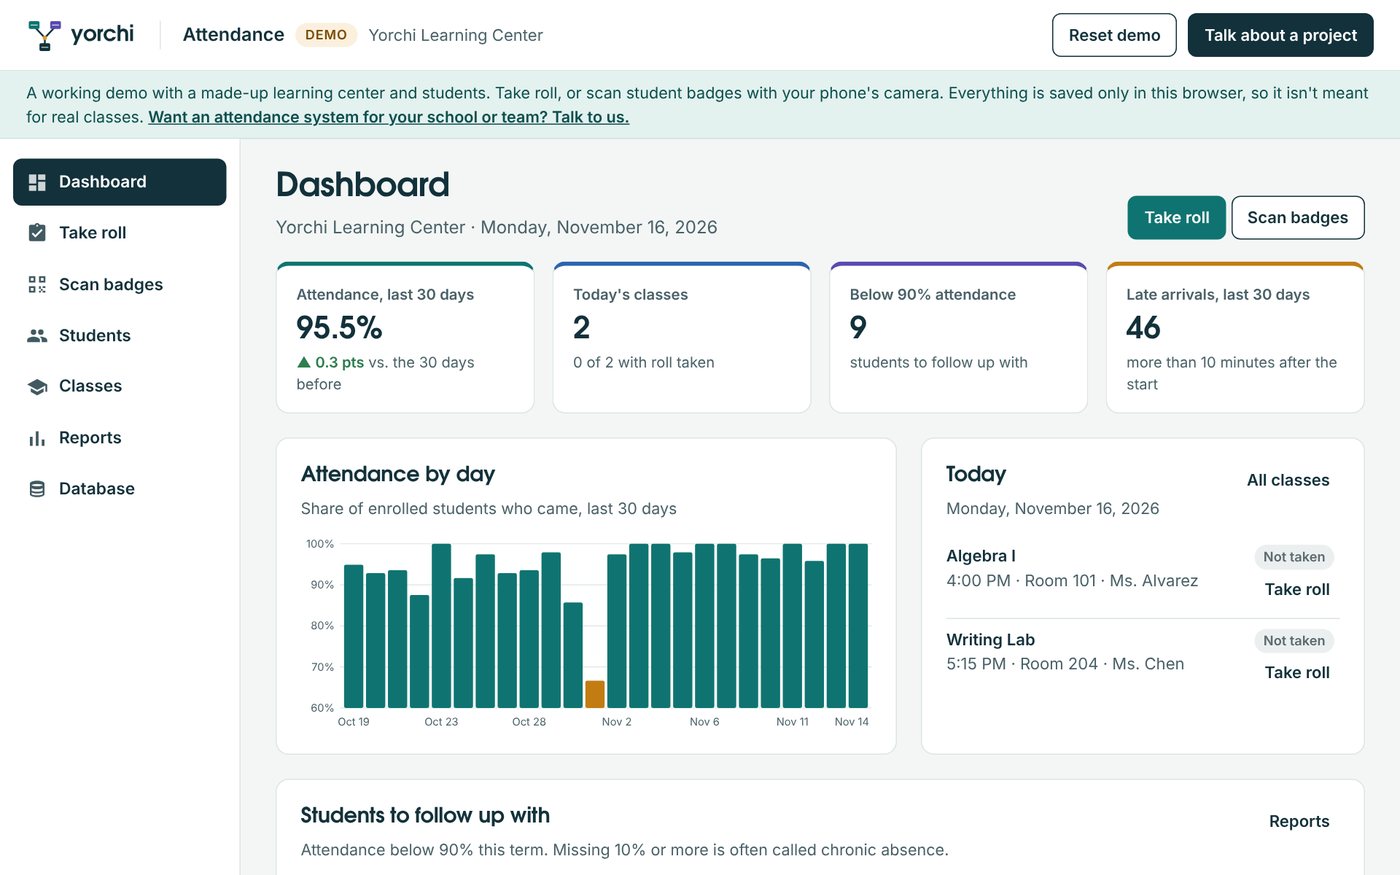
Attendance dashboard with the 30-day attendance rate, a daily attendance chart, today's classes, and students to follow up with
Database + web app + QR codes

Attendance system

A learning center with seven classes, 56 students, and seven weeks of attendance.

  • Roll call in a few taps: present, late, absent, or excused
  • QR code badges scanned at the door with a phone's camera, with late arrivals marked automatically
  • Early-warning reports: chronic absence, attendance by class and by day of the week
  • The database design and SQL behind every screen
Open the demo
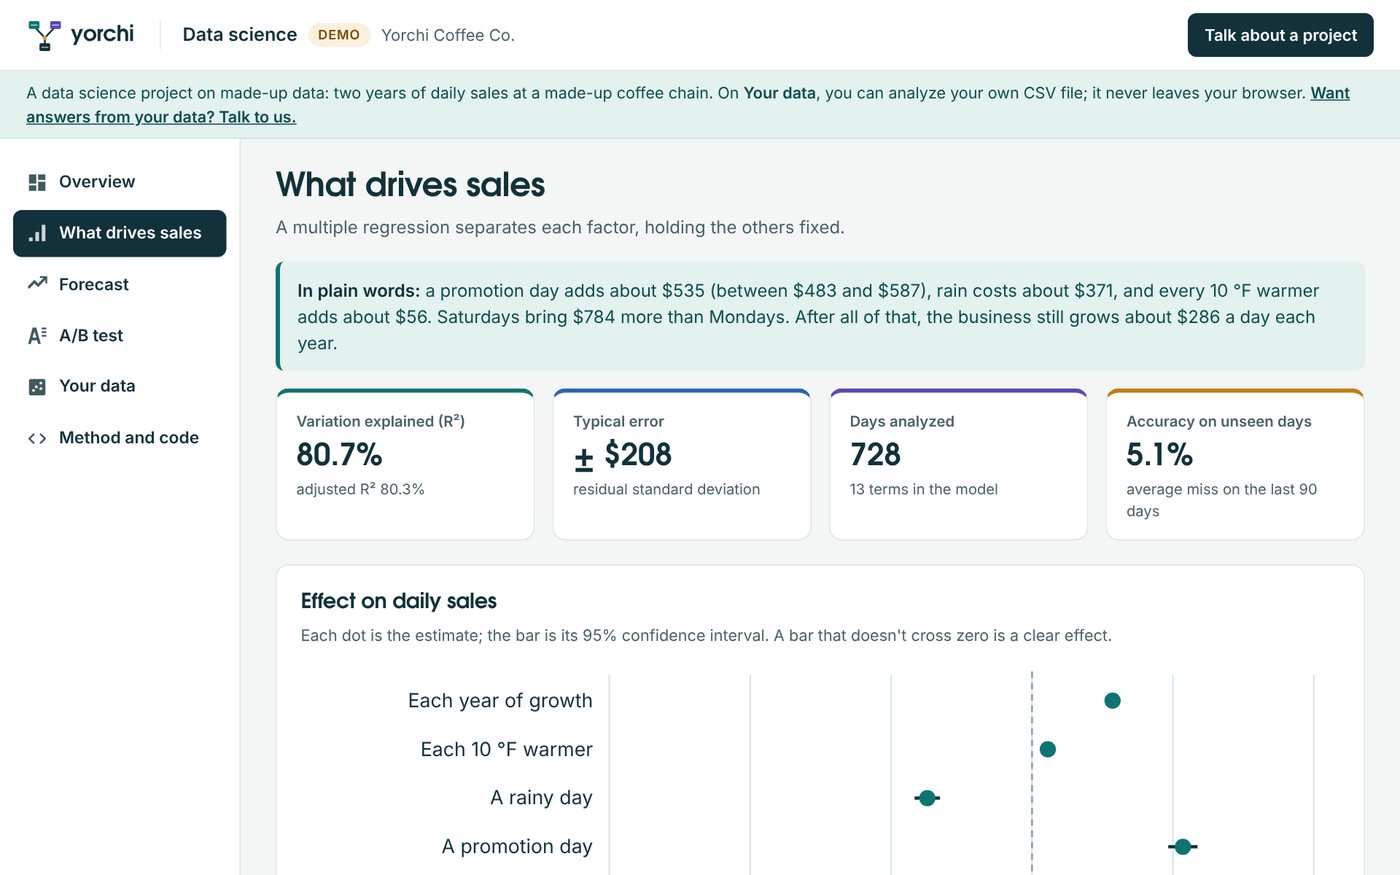
Regression results showing each factor's effect on a coffee chain's daily sales, with 95% confidence intervals
Statistics + forecasting + A/B testing

Data science

Two years of daily sales at a coffee chain, analyzed to answer the owner's questions.

  • What really drives sales: weather, promotions, holidays, and the day of the week, each with a 95% confidence interval
  • A 14-day forecast with prediction intervals, tested on days the model never saw
  • An A/B test of two email offers, and how many emails the next test needs
  • Upload your own CSV and get a regression with confidence and prediction bands
Open the demo

How we work

Every project follows the same four steps, so you always know what comes next.

  1. Discover

    We learn how your business uses data today and what you need it to do.

  2. Design

    We design the website, app screens, database, and reports before building.

  3. Build

    We develop the site, apps, and database, test them with your data, and train your team.

  4. Analyze

    We put your data to work with statistics and models, and keep improving the system.

Tools we use

Some of the tools we use include the following. We also work with the systems your team already has.

  • Oracle
  • MySQL
  • SQL and PL/SQL
  • PHP
  • Python
  • R
  • Excel
  • HTML, CSS, and JavaScript
  • Web and mobile frameworks

The expertise behind every project

Our work is led by highly trained and educated professionals in database systems, statistics, data science, and data management. We work with tools such as MySQL, Oracle, Python, and R.

  • Database designData modeling, SQL, and PL/SQL for databases that stay reliable as you grow.
  • Statistics and data scienceRegression, prediction intervals, hypothesis testing, and machine learning, applied to your data.
  • Clear explanationsWe explain our methods and results in plain language, so you can understand them and act on them.
  • Training your teamDocumentation and hands-on training so your staff can use what we build.

Tell us about your data

Answer a few quick questions about your data and your goals, and we'll reply with next steps and an estimate.